SY2025 Data Insights
Let’s have a conversation
The Centers for Medicare & Medicaid Services (CMS) released the 2025 Star Ratings for Medicare Advantage plans on October 10th, 2024.
Following the dramatic impact of Tukey outlier deletion in Star Year 2024, Star Year 2025 didn’t face uncertainties or shock in methodology. Instead, we realized an upswing in cut points and the knock-on effect of Tukey and compressed distribution of scores. The guardrails, restricting the majority of measure cut point movement (+/- 5 pts) were in place and had impacts on Stars ratings and plan performance. In a year-over-year trend, the Medicare Advantage Prescription Drug (MAPD) contract enrollment weighted average for Star ratings decreased and faced one of the lowest levels in nearly a decade – shifting from 4.07 to 3.92.
The Star performance ratings also showed that 40% of MAPD plans earned an overall rating of 4 stars or higher for Star Year 2025, down slightly from 42% in Star Year 2024. When weighted by enrollment, 62% of MAPD enrollees are currently in 4+ Star plans for Star Year 2025 which is a significant drop from last year’s 74%.
Seven MAPD contracts earned 5 stars, marking them as the highest quality "high performing" Medicare Advantage plans. The Centers for Medicare & Medicaid Services highlighted these plans on the Medicare Plan Finder website to help beneficiaries identify top-rated options. This is a stark reduction from the 38 5-star plans in 2024. Medicare Advantage Prescription Drug plans with longer tenure also scored higher relative to newer plans, with five of the seven 5-Star plans being established programs for 10+ years. We’ve seen the number of 5-Star plans decrease steadily over the past few years, but with the removal of the reward factor starting in SY26 and the introduction of the health equity index, achieving that 5 Star rating will likely continue to prove more and more difficult.
Our team put together our SY2025 Insights and Analysis to begin to “tell the story” for Star Year 2025. If you have any questions or are curious to speak about your plan's Star Rating, contact ProspHire to see how we can help improve your Star ratings.
Rating Swing Distribution from Prior Year1
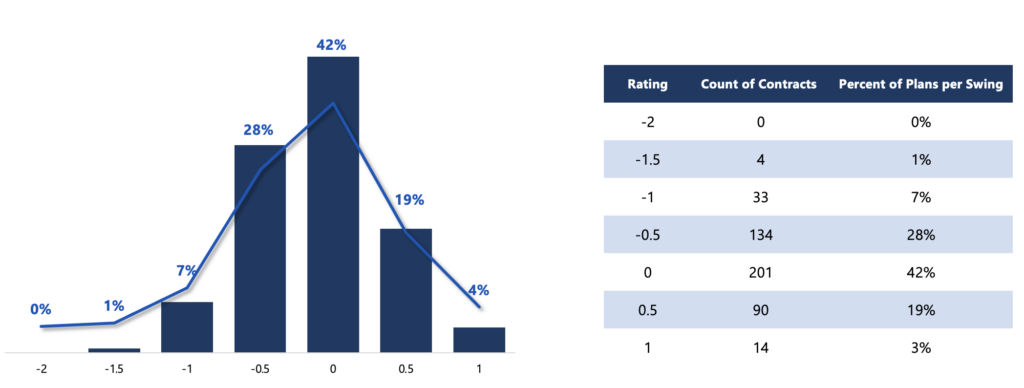
Graph Description:
- Compares Health Plans Overall Star Rating between SY2024 and SY2025.
- Only includes Local CCP, Regional CCP, PFFS and 1876 Cost. Excludes MSA, PDP, Employer Group.
- Excludes Contracts that did not have a Star Rating in SY2024 or did not have enough data available.
Distribution of Star Rating SY2024 and SY20251
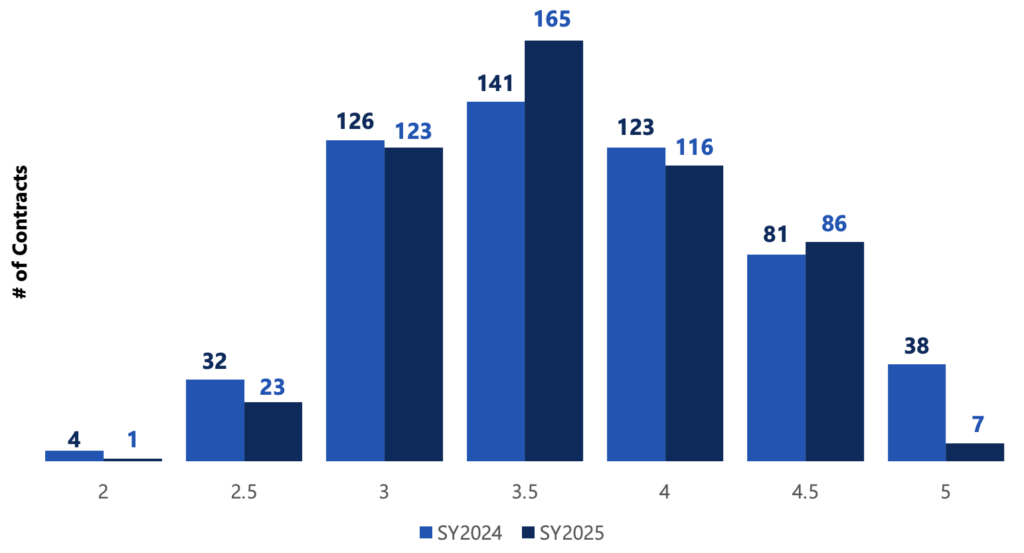
Graph Description:
- Identified the total count of contract that received a Star Rating in Star Year 2024 and Star Year 2025 and shows the distribution over each year.
- Only includes Local CCP, Regional CCP, PFFS and 1876 Cost. Excludes MSA, PDP, Employer Group.
- Excluded any plans that were too new to be measured, not enough data available, or not applicable.
Distribution of Domain Level Performance
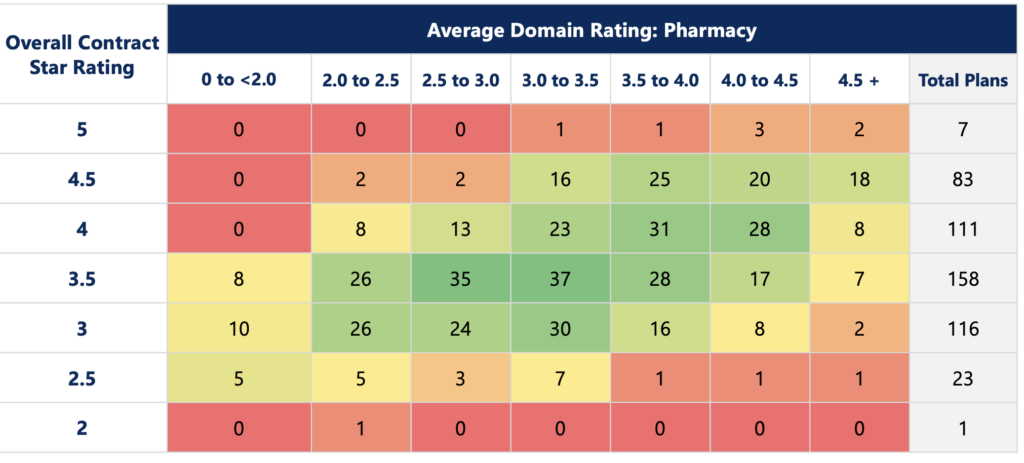
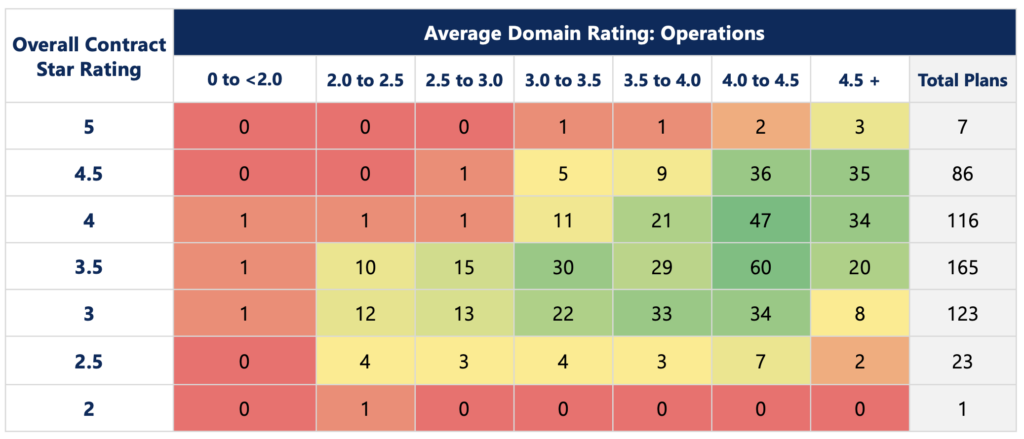
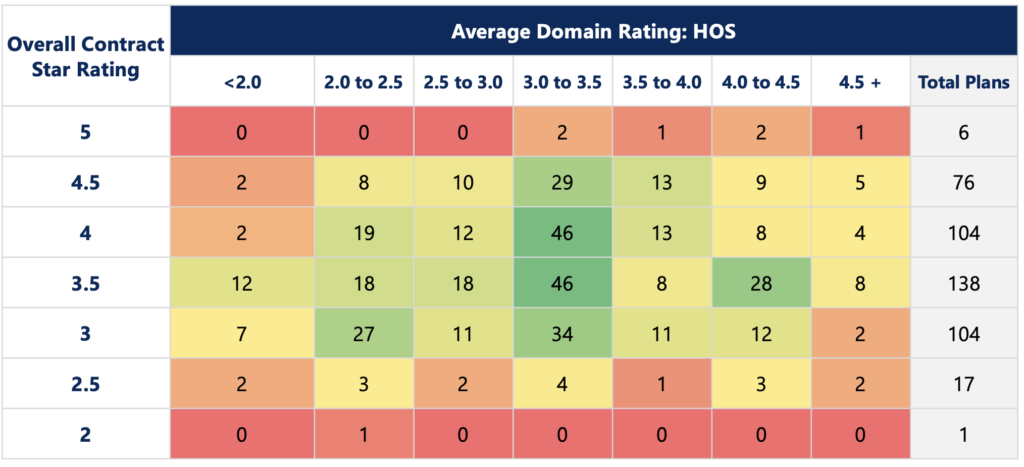
Using the data presented in the tables below, our team conducted a comprehensive analysis on the distribution of overall plan ratings in correlation with a plan's performance in five domains: Consumer Assessment of Healthcare Providers and Systems (CAHPS), Healthcare Effectiveness Data and Information Set (HEDIS), Pharmacy, Operations and Health Outcomes Survey (HOS).
Key Highlights:
- The Operations domain demonstrated a more concentrated performance range for high-performing plans, with 75% of 4.0+ Star plans achieving a score of 4.0 or higher in the designated measures.
- In order to achieve 4.0+ Stars, plans were required to succeed in CAHPS. Of the 189 plans that received a 4.0+ star, 82% of them had a minimum CAHPS scoring average of 3.5 Stars.
- In line with CMS methodology weighting, HEDIS, Pharmacy, and HOS showed a more expected spread in overall health plan performance based on the domain's average Star rating.
In summary, the health plan operations domain stands out as a consistent and influential factor driving higher Star ratings for health plans. With the shift in weighting moving away from the 4x in the member experience focused measures in operations (e.g., Members Choosing to Leave the Plan, Complaints, and TTY/FLI) the question becomes, "How will performance be impacted for SY26?" A strong focus on HEDIS and HOS will be required especially with the return of the two tripled weighted (x3) Improving/Maintaining Physical/Mental Health measures in HOS for SY2027.
As we enter the final stretch of the performance year SY2024, it is essential to place significant emphasis on the efforts of Q4. Health plans should arrange all available resources and make every effort, giving special attention to driving improvements in HEDIS performance. This Q4 push can act as an additional safeguard prior to the CAHPS survey distribution in March 2025. The MA marketplace faces many headwinds, including benefit reductions across many of the health plans and how plans communicate these changes broadly to their membership could have a significant impact on CAHPS results.
As we look ahead to the future of Stars and the “new normal” we continue to see tremendous value in investing in digital measurement transformation, electronic clinical data systems optimization, interoperability and health data exchanges. The industry will continue to shift this way and the health plans that invest now in this will end up being the biggest winners long term.
Plan Count by Overall Rating & Average CAHPS Rating1,2,3
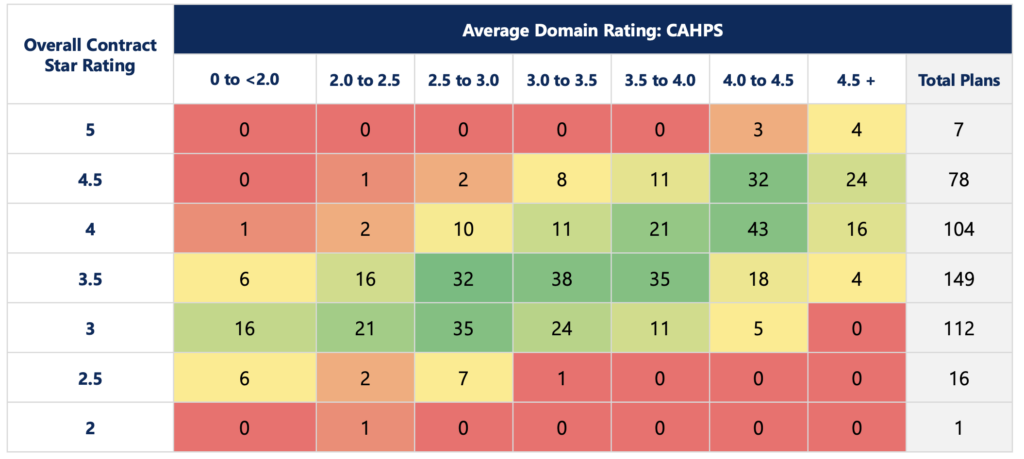
Graph Description:
- ProspHire categorizes the CAHPS domain based on the following 9 measures: Annual Flu Vaccine, Getting Needed Care, Getting Appointments and Care Quickly, Customer Service, Care Coordination, Rating of Heath Care Quality, Rating of the Health Plan, Rating of the Drug Plan, Getting Needed Rx Drugs
- Measures that were noted by CMS as ‘Not enough data available’, ‘No data available’, ‘Plan too small to measure’ did not count in the domain calculation per plan due to CMS methodology of excluding those measures in the overall Star rating calculation.
- Totals will vary across graphics as some health plans may not have been able to score for some domain categories due to unavailable data as noted in item 2.
Plan Count by Overall Rating & Average HEDIS Rating1,2,3
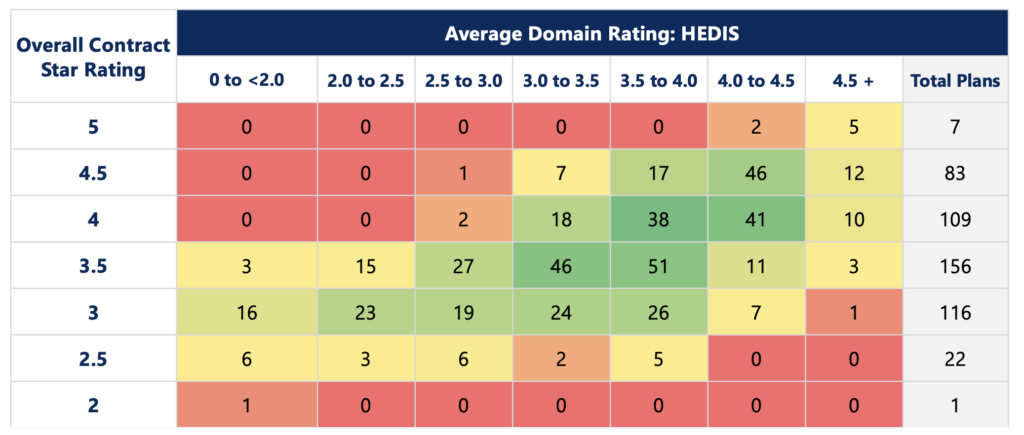
Graph Description:
- ProspHire categorizes the HEDIS domain based on the following 13 measures: Breast Cancer Screening, Colorectal Cancer Screening, Care for Older Adults - Medication Review, Care for Older Adults - Pain Assessment, Osteoporosis Management in Women who had a Fracture, Diabetes Care - Eye Exam, Diabetes Care - Blood Sugar Controlled, Controlling High Blood Pressure, Medication Reconciliation Post-Discharge, Plan All-Cause Readmissions, Statin Therapy for Patients with Cardiovascular Disease, Transitions of Care, Follow-up after Emergency Department Visit for People with Multiple High-Risk Chronic Conditions
- Measures that were noted by CMS as ‘Not enough data available’, ‘No data available’, ‘Plan too small to measure’ did not count in the domain calculation per plan due to CMS methodology of excluding those measures in the overall Star rating calculation.
- Totals will vary across graphics as some health plans may not have been able to score for some domain categories due to unavailable data as noted in item 2.
Plan Count by Overall Rating & Average Pharmacy Rating1,2,3
Graph Description:
- ProspHire categorizes the Pharmacy domain based on the following 5 measures: Medication Adherence for Diabetes Medications, Medication Adherence for Hypertension (RAS antagonists), Medication Adherence for Cholesterol (Statins), MTM Program Completion Rate for CMR, Statin Use in Persons with Diabetes (SUPD)
- Measures that were noted by CMS as ‘Not enough data available’, ‘No data available’, ‘Plan too small to measure’ did not count in the domain calculation per plan due to CMS methodology of excluding those measures in the overall Star rating calculation.
- Totals will vary across graphics as some health plans may not have been able to score for some domain categories due to unavailable data as noted in item 2.
Plan Count by Overall Rating & Average Operations Rating1,2,3
Graph Description:
- ProspHire categorizes the Operations domain based on the following 10 measures: Special Needs Plan (SNP) Care Management, Plan Makes Timely Decisions about Appeals, Reviewing Appeals Decisions, Call Center - Foreign Language Interpreter and TTY Availability, Complaints about the Health Plan, Complaints about the Drug Plan, Members Choosing to Leave the Plan – Part C and Part D, MPF Price Accuracy.
- Measures that were noted by CMS as ‘Not enough data available’, ‘No data available’, ‘Plan too small to measure’ did not count in the domain calculation per plan due to CMS methodology of excluding those measures in the overall Star rating calculation.
- Totals will vary across graphics as some health plans may not have been able to score for some domain categories due to unavailable data as noted in item 2.
Plan Count by Overall Rating & Average HOS Rating1,2,3
Graph Description:
- ProspHire categorizes the Health Outcome Survey (HOS) domain based on the following 3 measures: Reducing the Risk of Falling, Improving Bladder Control, Monitoring Physical Activity
- Measures that were noted by CMS as ‘Not enough data available’, ‘No data available’, ‘Plan too small to measure’ did not count in the domain calculation per plan due to CMS methodology of excluding those measures in the overall Star rating calculation.
- Totals will vary across graphics as some health plans may not have been able to score for some domain categories due to unavailable data as noted in item 2.
© 2025 ProspHire, LLC. All Rights Reserved / Terms of Use / Privacy Policy


